
# Integration with Google Analytics
# Introduction
One of the most important things when making decisions is to be able to visualize data and the best way is to have it on a simple, easy-to-share, and fully customizable dashboard.
That's why we recommend using Data Studio, Google's reporting solution that allows you to create personalized data visualizations.
We've created Data Studio templates that you can use as a basis for connecting directly to your Digital Channel data in minutes.
Google Analytics+Search Console+Ecommerce
This template is for sites where you have Google Search Console and Google Analytics installed with e-commerce functionality enabled.Google Analytics+ Search Console
This template is for sites where you have Google Analytics and Search Console installed.Google Analytics
This template is for sites where you have Google Analytics installed.# Prerequisites
To complete this tutorial, you need a Modyo Platform and Google account.
# Step 1: Choose the Data Studio template you want to use
For this tutorial we will use the Google Analytics+ Search Console template. This template is designed to give you an overview of the metrics related to acquisition, behavior, conversions, and SEO for your digital channels.
# Step 2: Account Setup in Data Studio
If this is your first time using Data Studio, you must do the account setup first, otherwise you won't be able to copy the report.
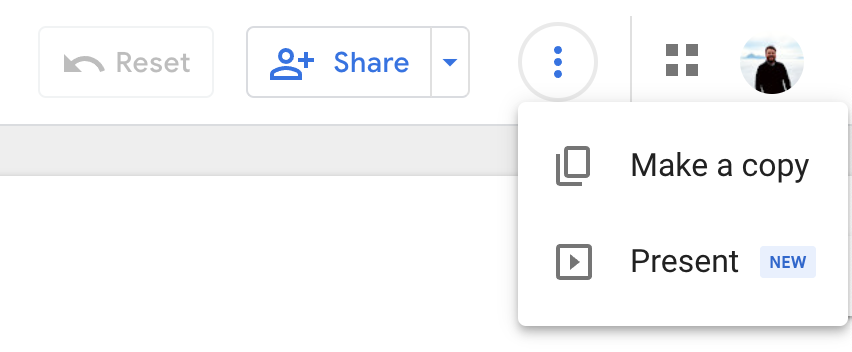
To do this, select the three dots next to Share and click Make a Copy .
If you haven't used Data Studio before, it will show you the following setup page. Select the country, desired language, and accept the Terms and Conditions.
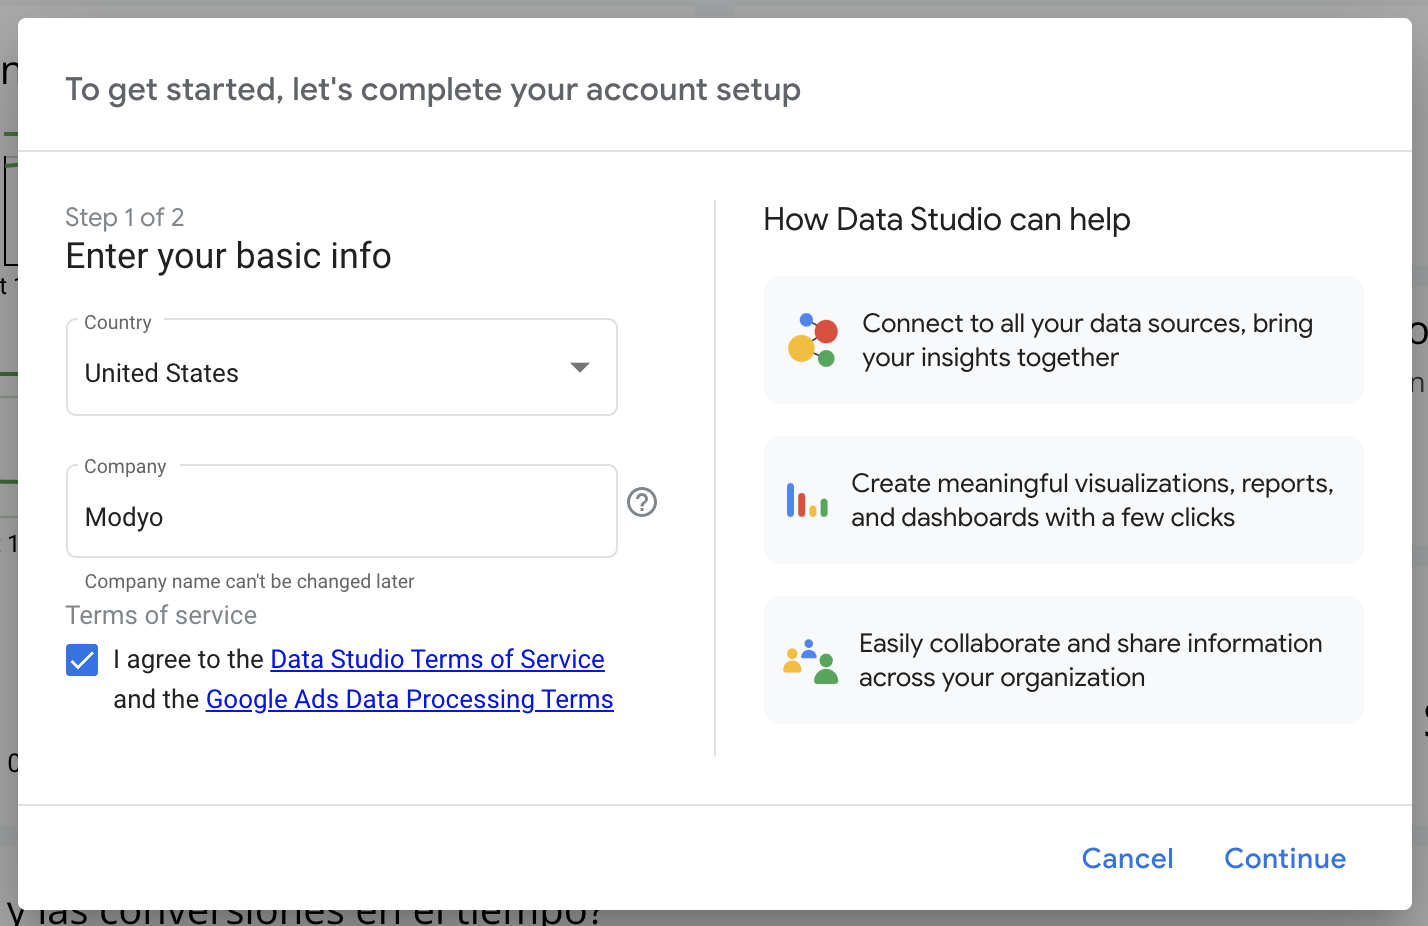
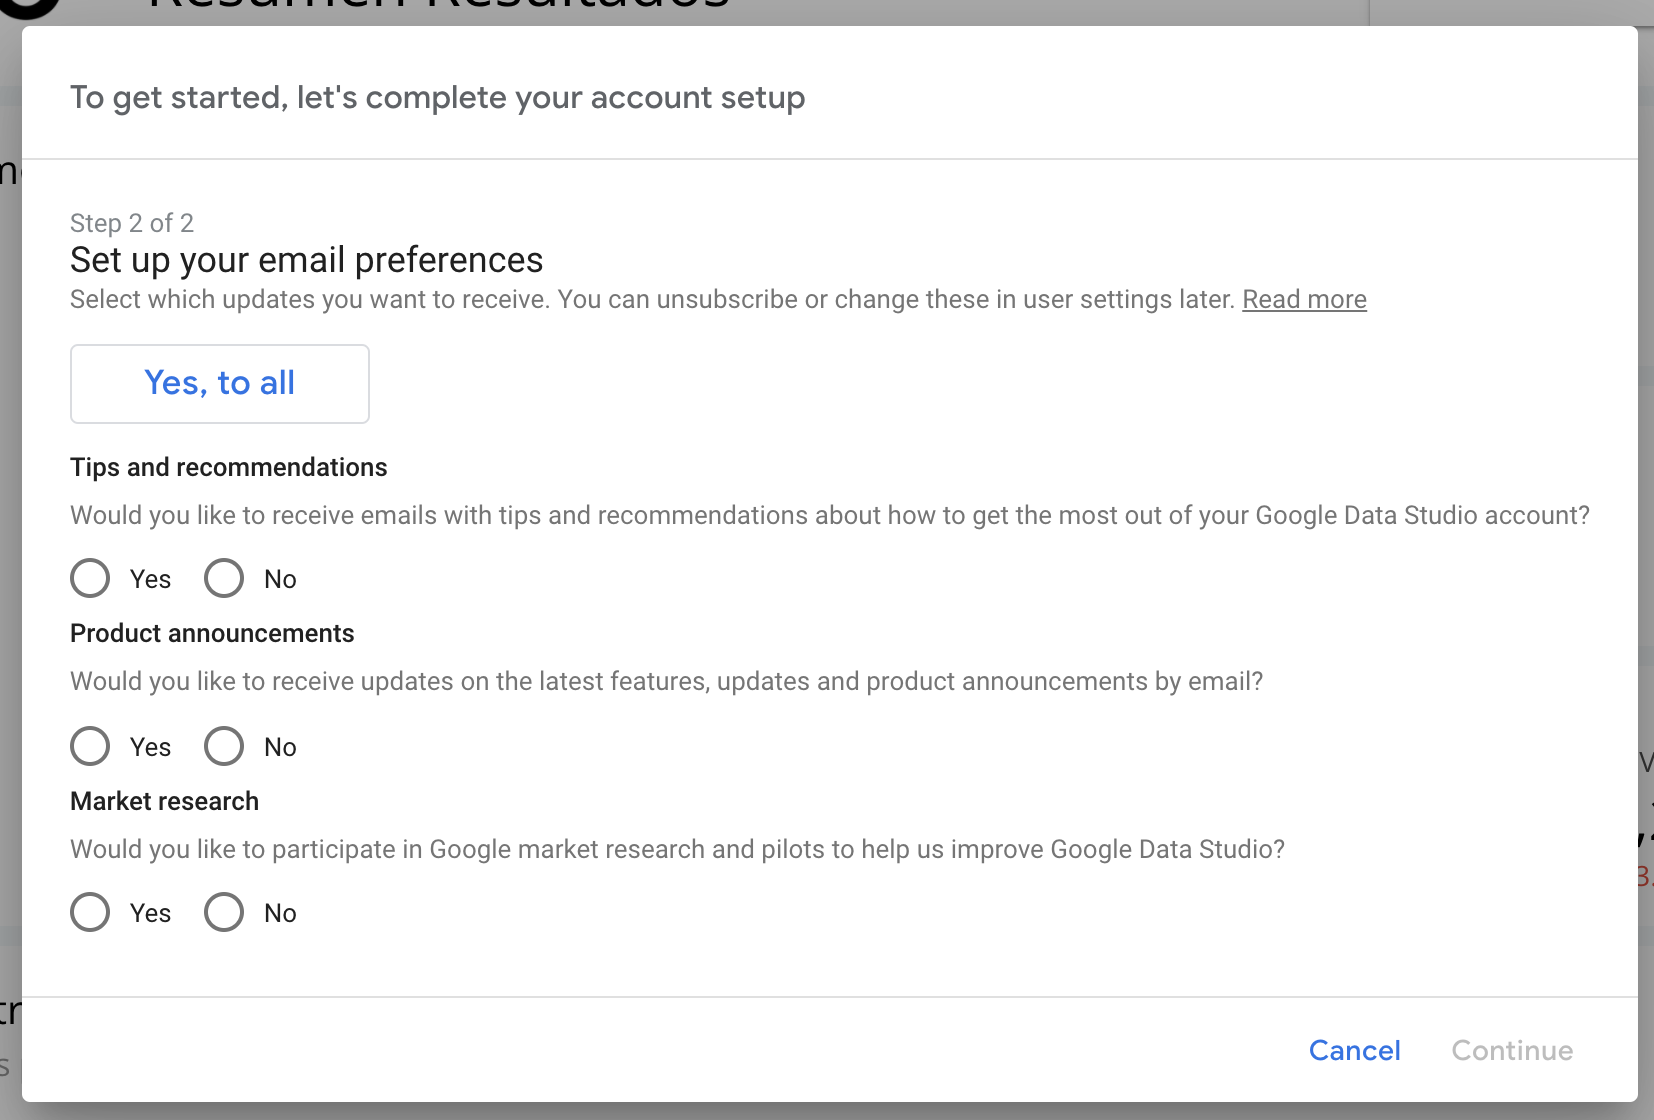
In case you want to receive additional information by email, active the checkbox.
# Step 3: Link Google Analytics
Once you have finished the process of setting up your Google account. Go back to the three dots and click Make a copy.
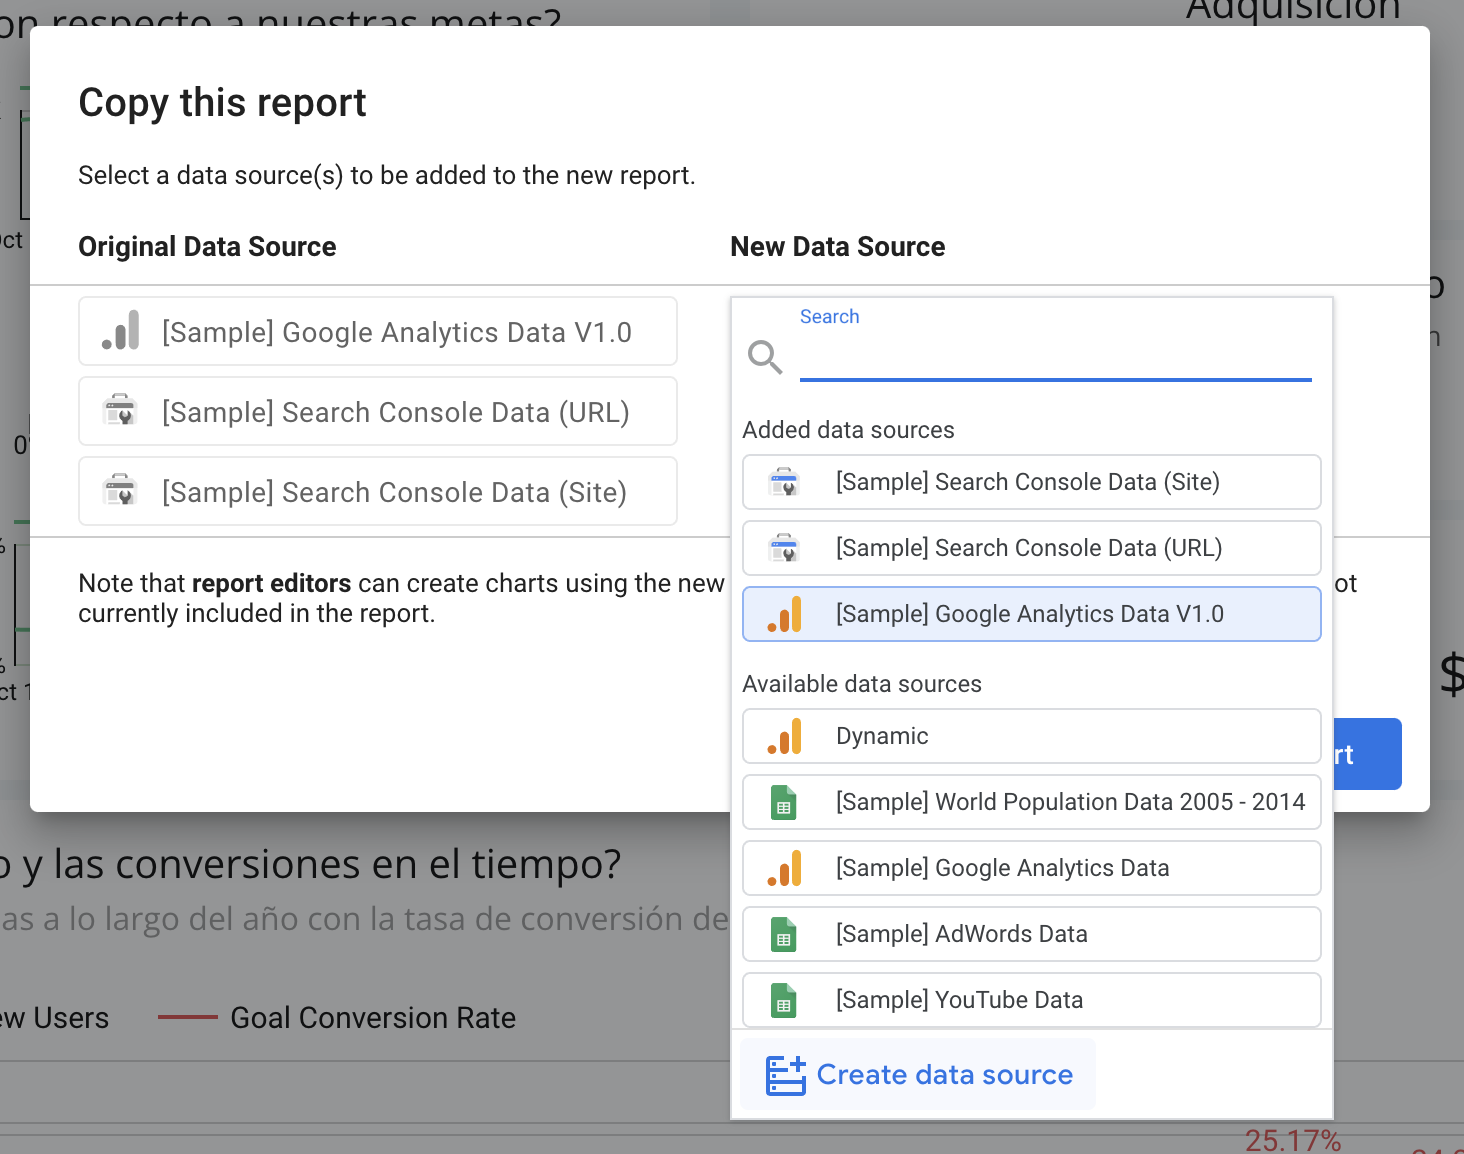
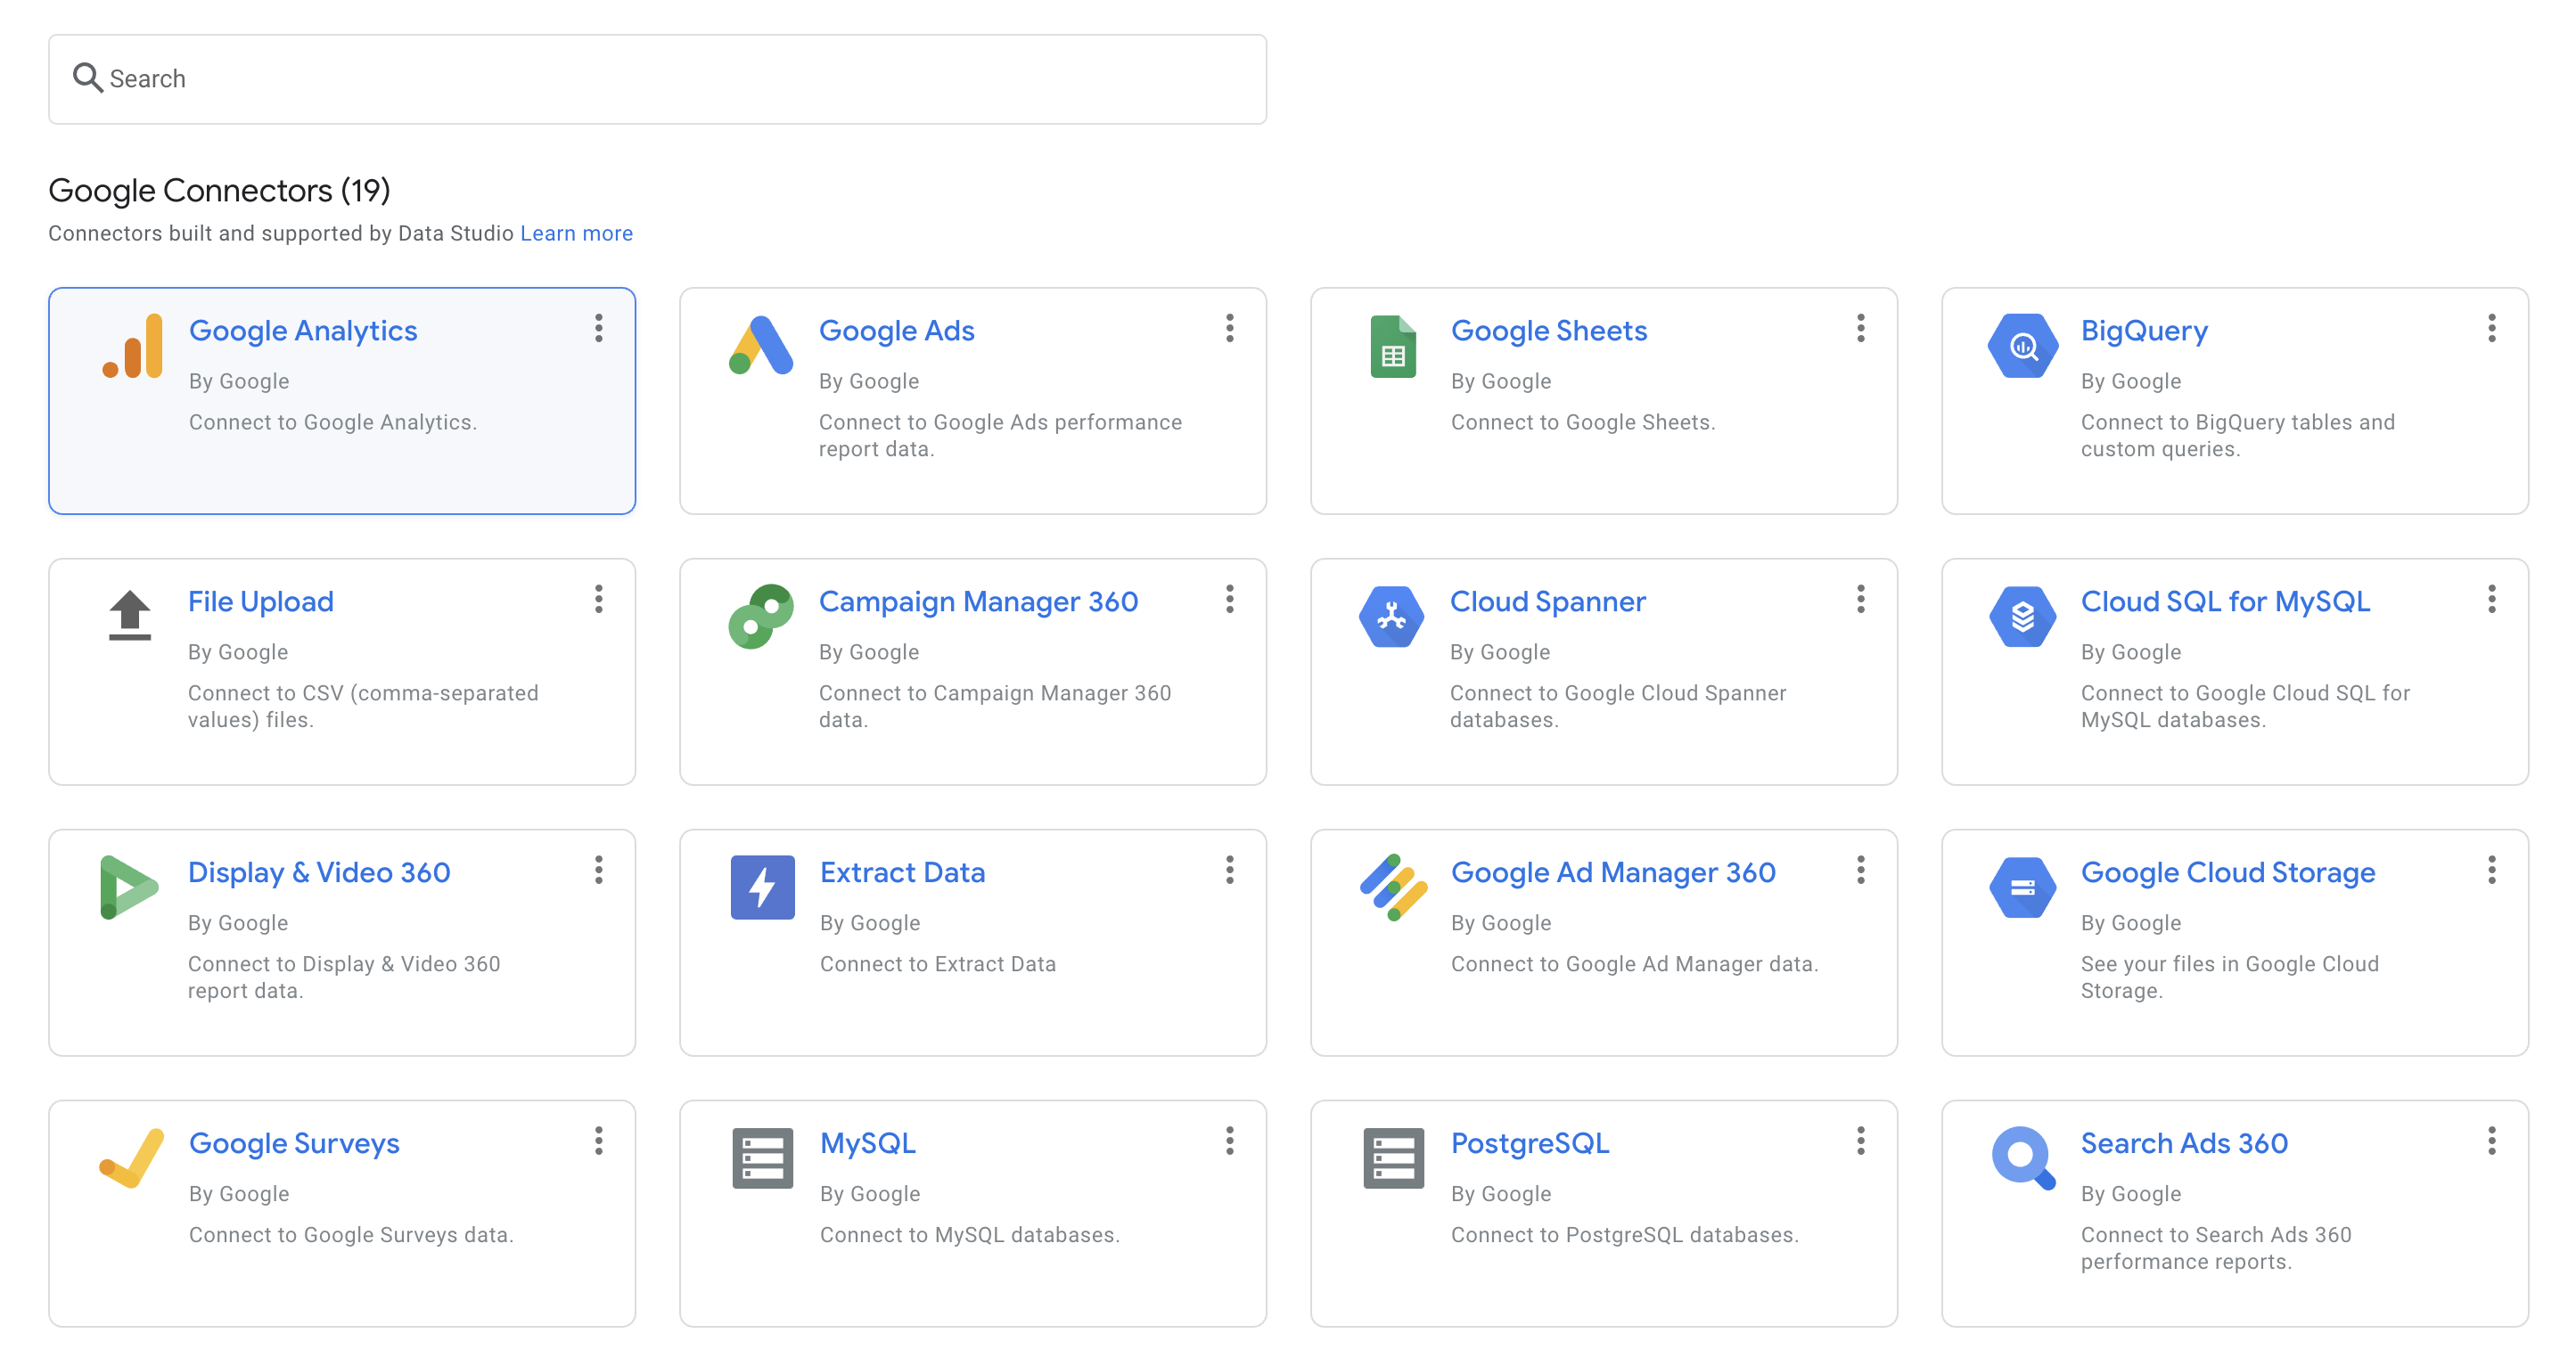
In the first list, click Create data source.
To create the data source, select Google Analytics and click on the account you want to measure and then click Connect.
In this view you can see all the symmetric data dimensions that are going to be connected to the report, the next step is to add them to the report.
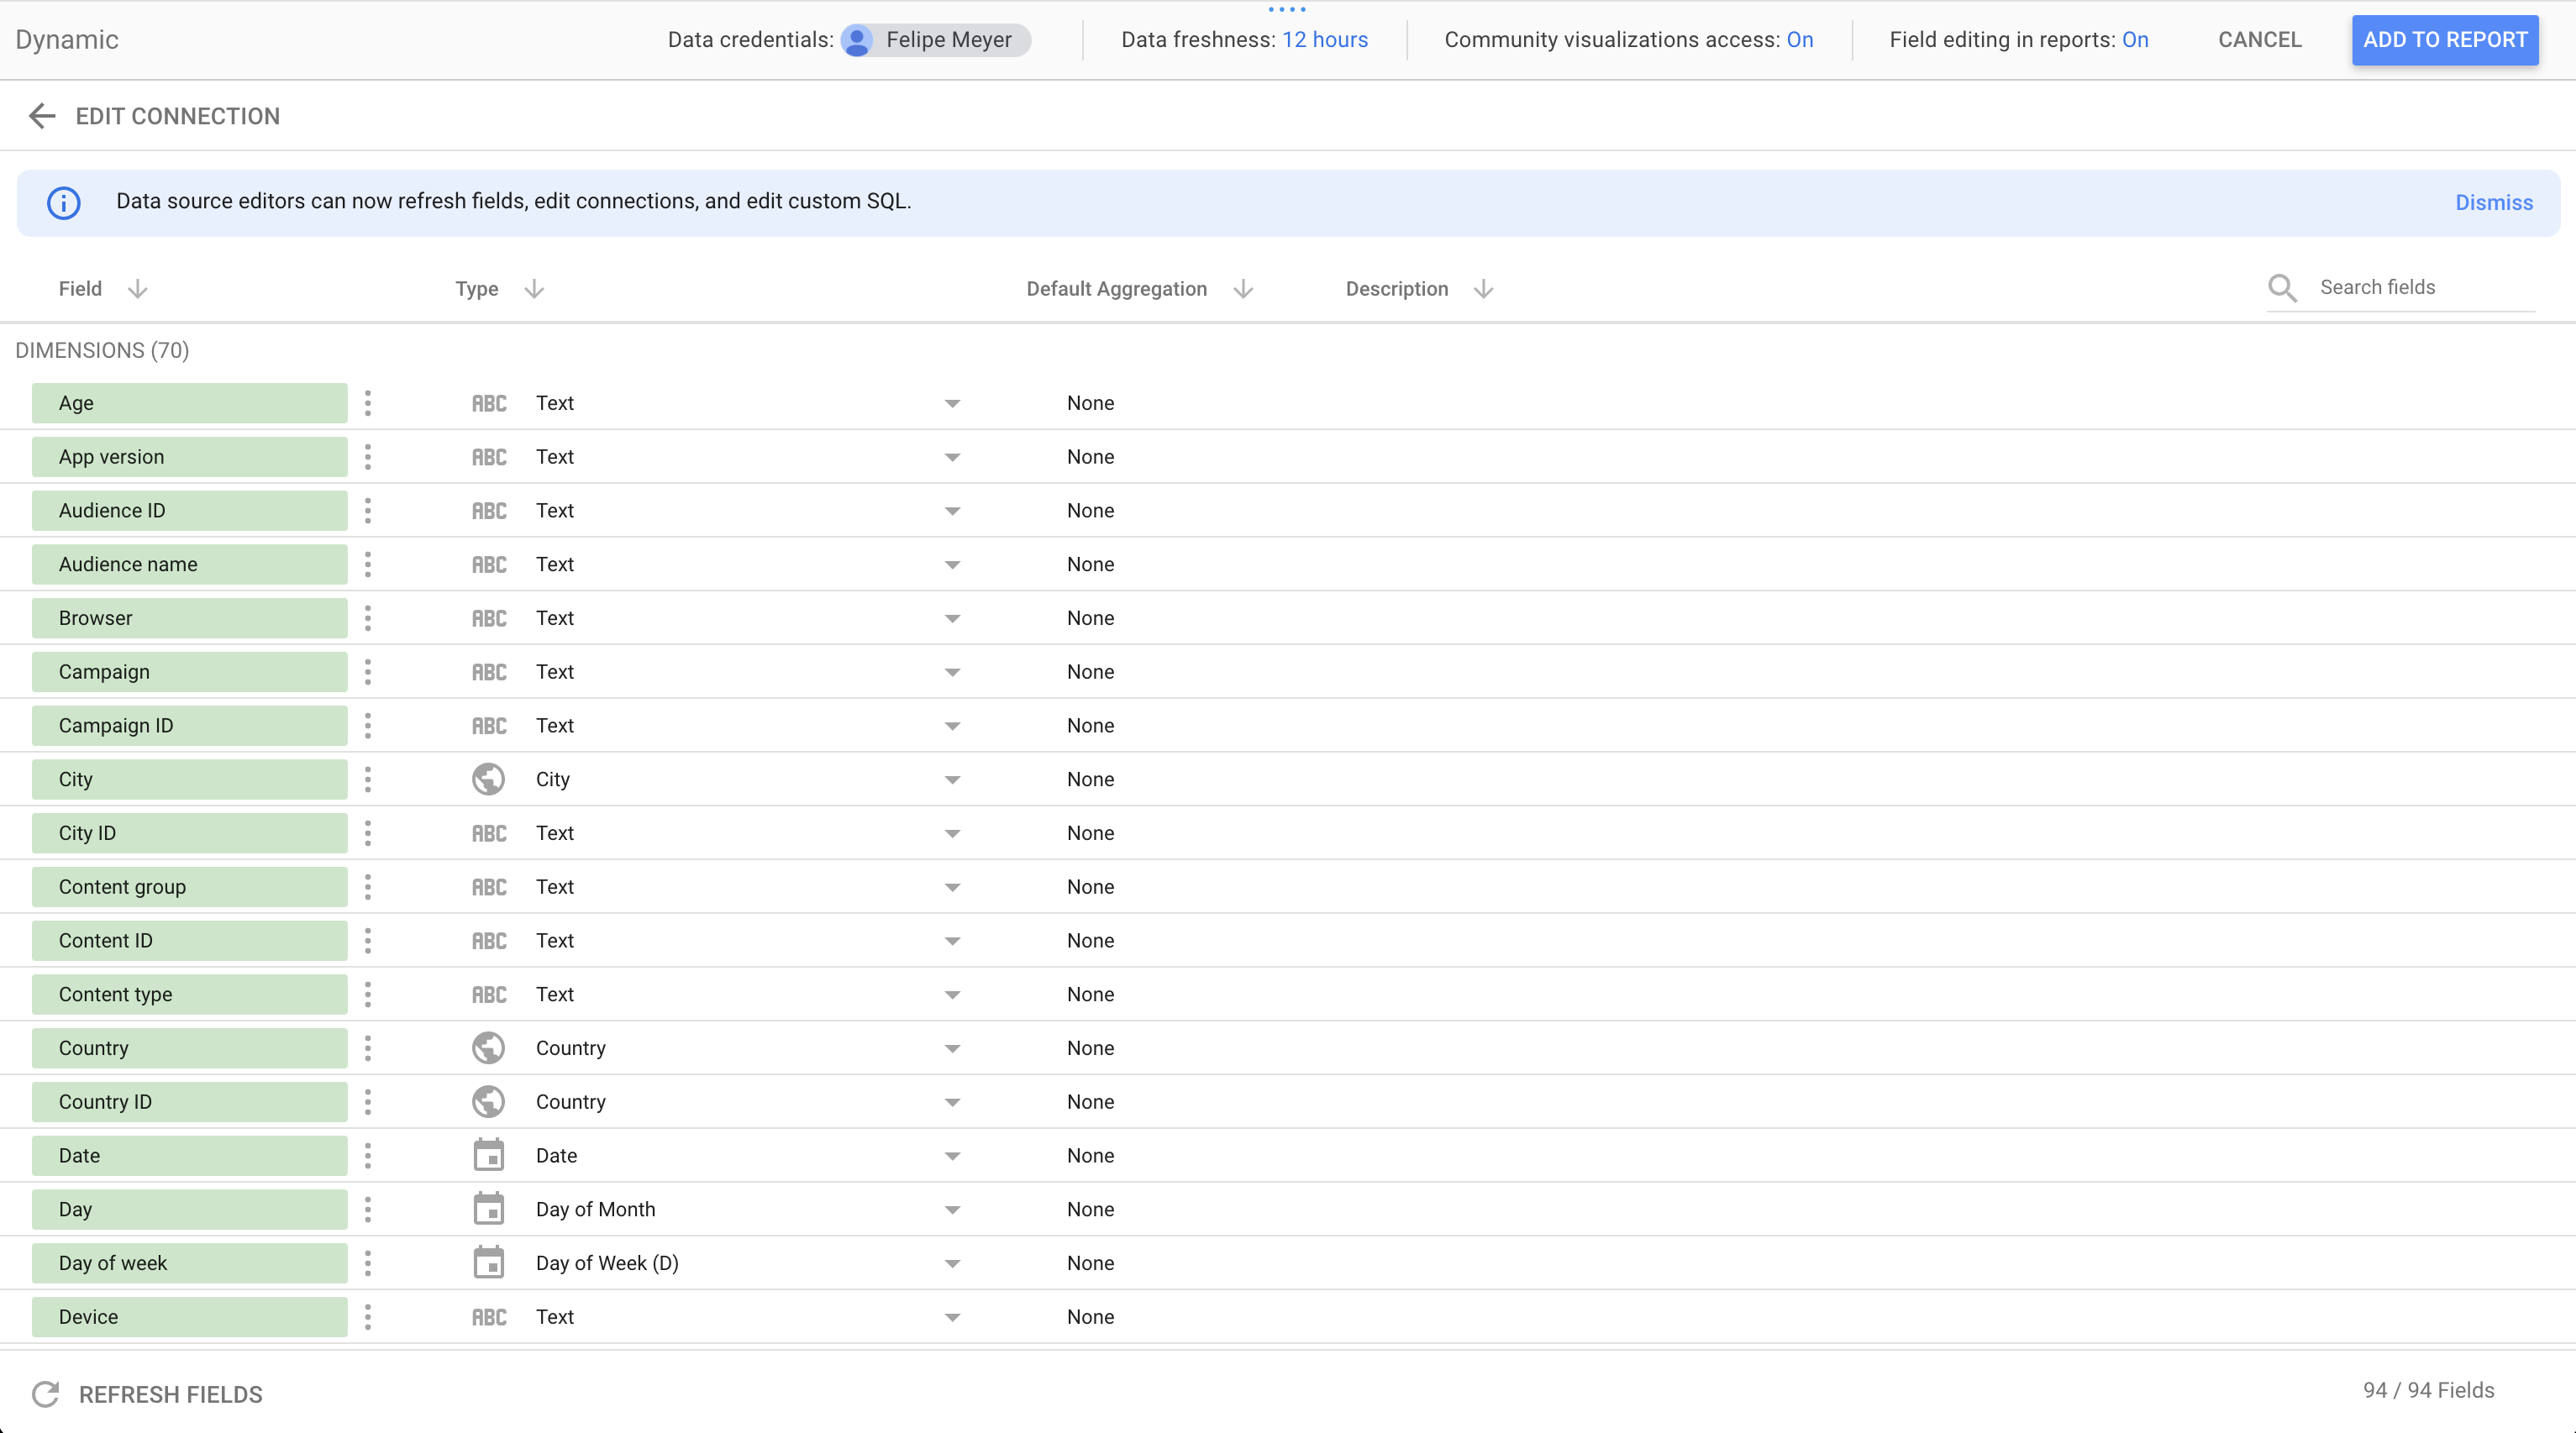
There is no need to modify anything, click Add to Report to continue.
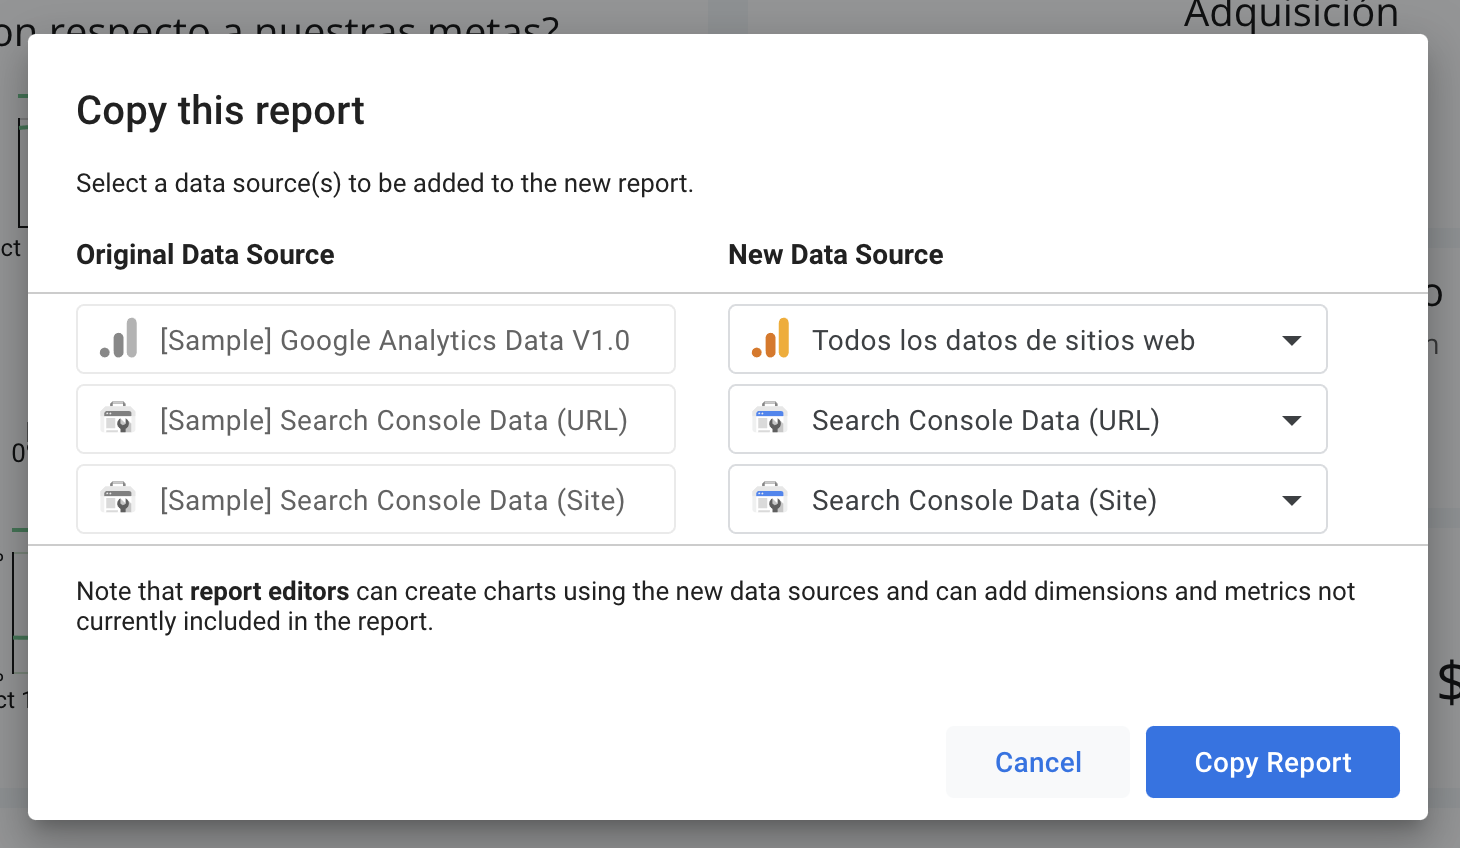
This will take you back to the Copy Report window.
# Step 4: Link Search Console
Once the report is linked to the Analytics Account, two more fields are selected Search Console Data (URL) and Search Console Data (SiTel) .
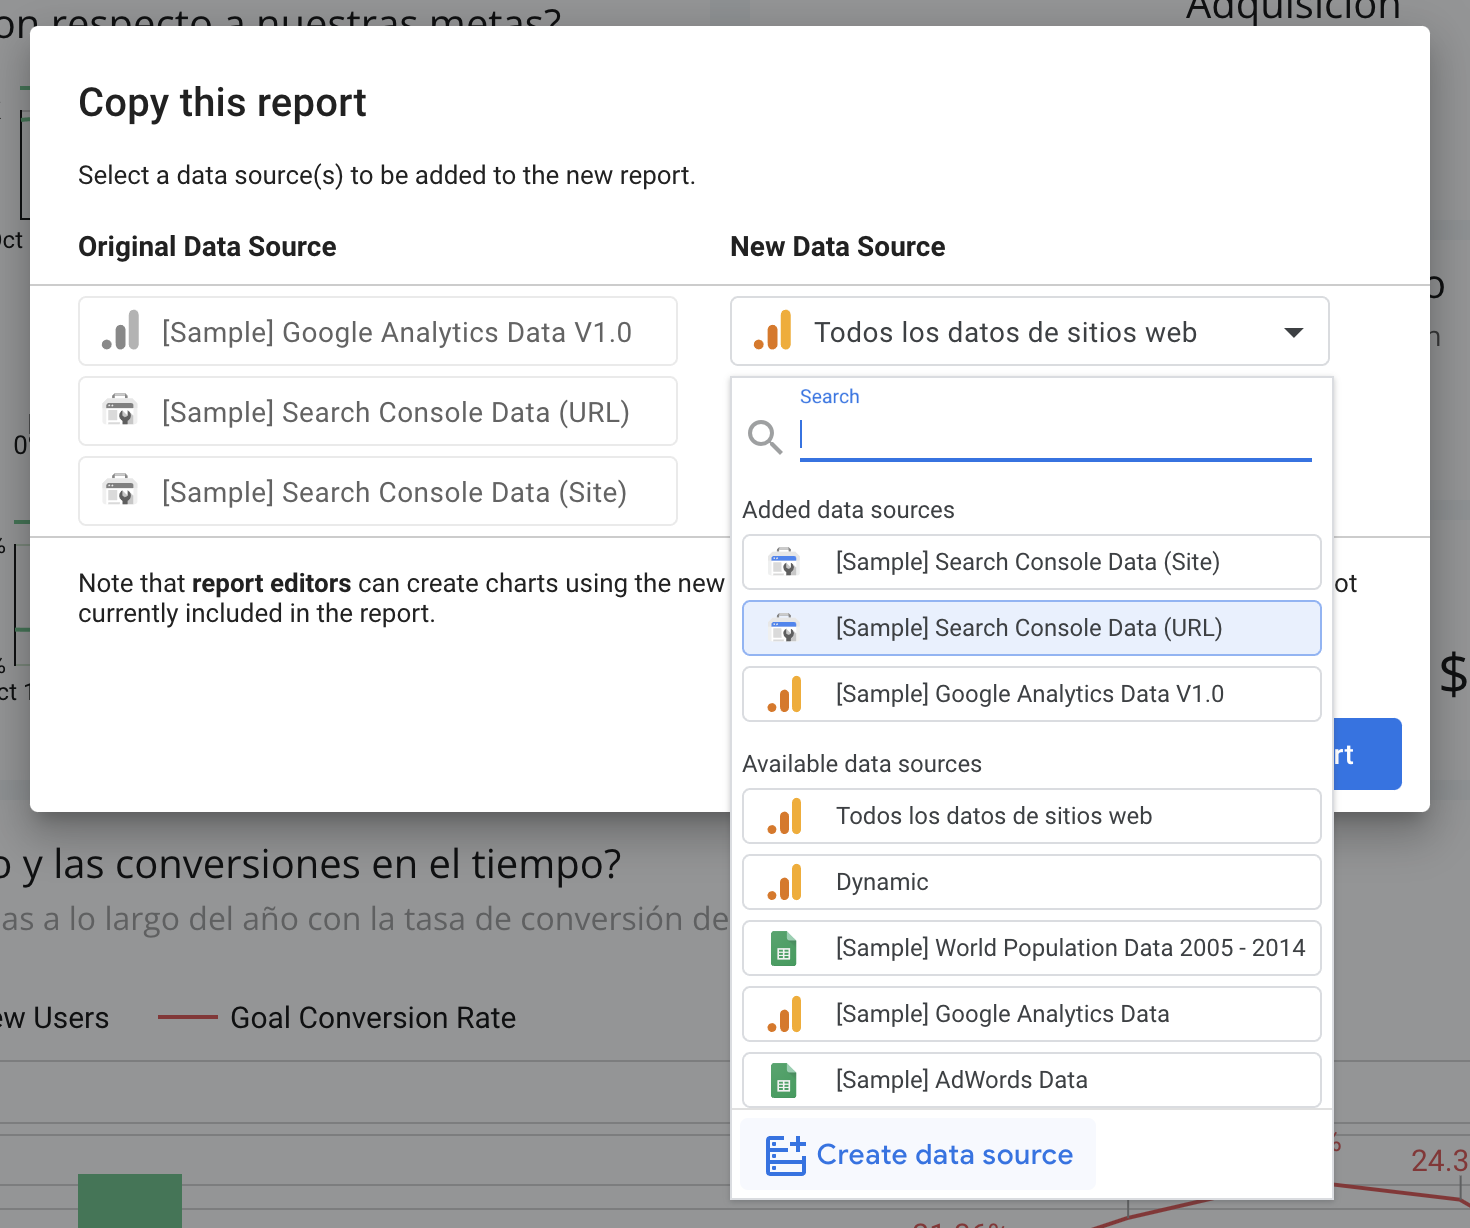
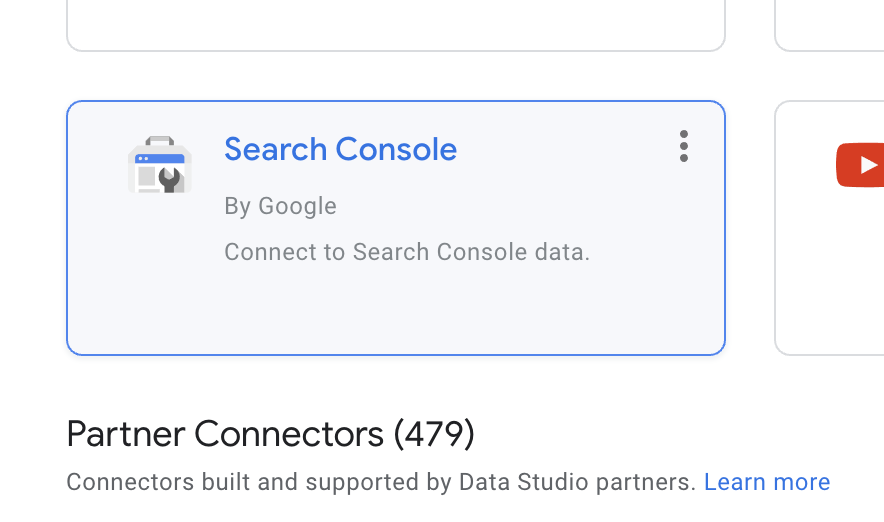
Follow the same procedure as the previous one, click Create data source, but this time select Search Console.
Follow the same procedure as before and choose the same site you chose for Google Analytics and select URL and Site respectively.
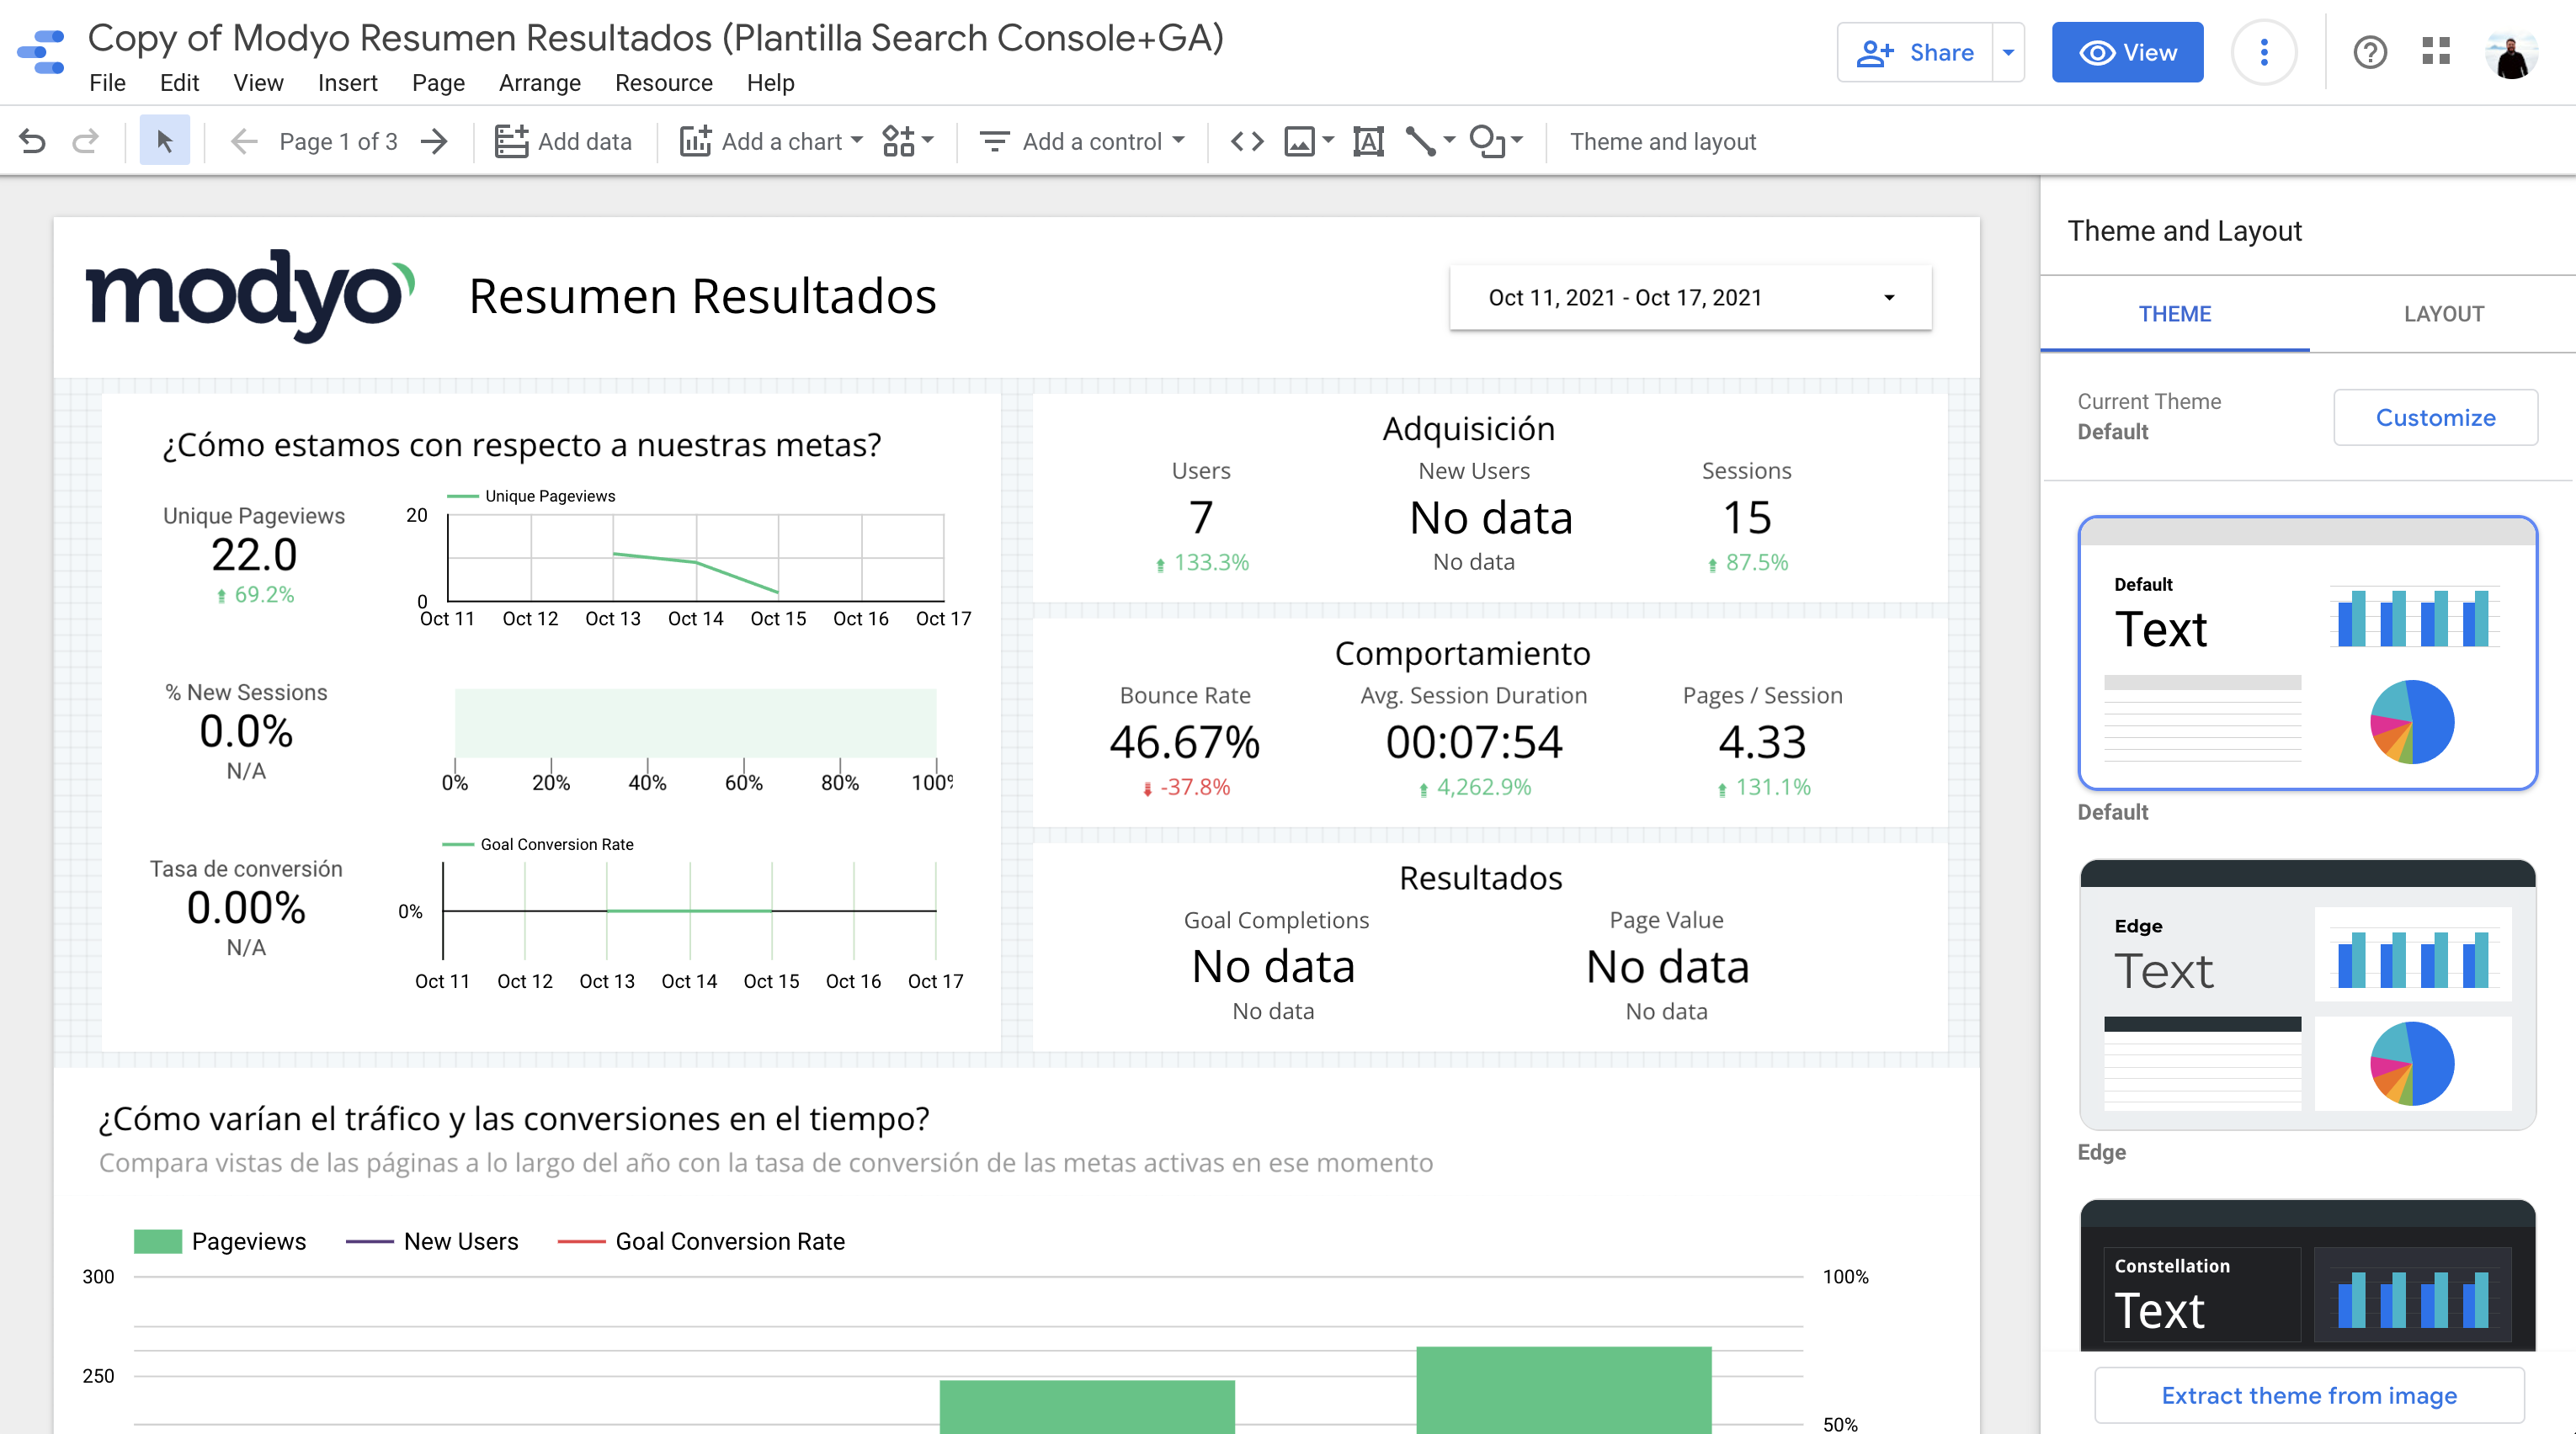
# Step 5: Copy the report with your data
Once all the data sources have been created, you can make a copy of the report, click the button Copy report.
Which will open your new report in a new window.
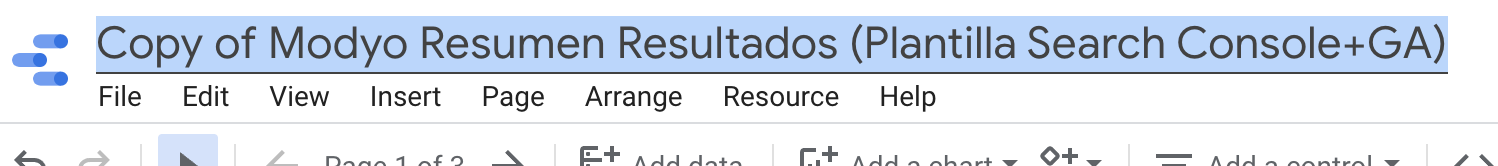
You can also change the name by clicking on it.
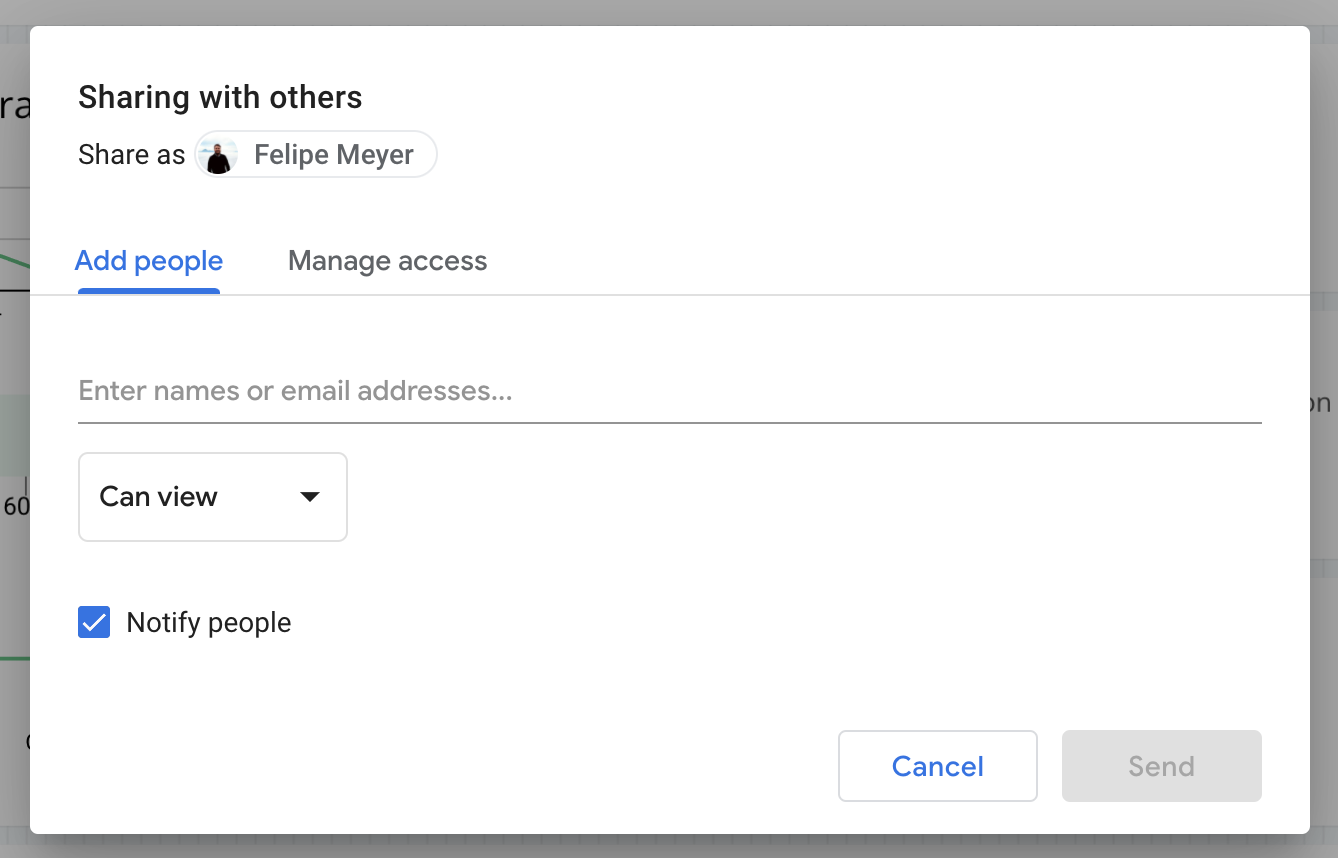
Finally you can share it with the button Share.
# Conclusion
Congratulations! You now have your Data Studio report and are ready to evaluate the performance of your digital channels.